Optimal Sizing of Microgrids: Case of the Skagerak Stadium in Norway
- Scope: 2 months
- Keywords: Microgrid, Optimization, Genetic Algorithm
- Tools: MATLAB, Excel
- Other Contributors: N. Hidayati, O. Olugbayila
- Links: [Github] [PDF]

The Problem
This project focuses on powering a football stadium with combined Photovoltaic and Battery Energy Storage System (BESS) connected to the grid. The distinct load profile of the football stadium and the energy generation coming from PV in Norway results in a significant excess power. This situation leads to the choice to connect the system to the grid with the main objective to sell the excess electricity produced.
The project seeks to optimize the size of each sub-system (PV panels & and battery cells), that needs to be installed. In addition to that, analysis of the yearly revenue and the payback period will also be made while taking into account the amount of electricity sold to the grid. The optimization is carried out using the genetic algorithm (GA) method implemented in MATLAB.
Implementation
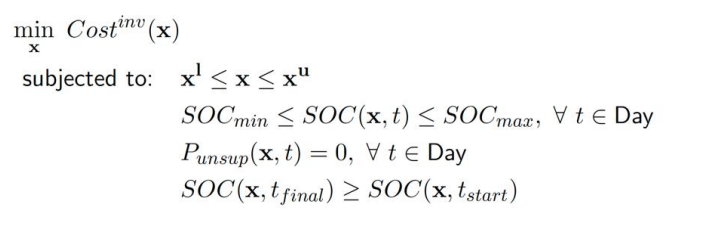
The objctive function can be mathematically modelled as:
where Cost_inv is Investment Cost, P_unsup is Unsupplied power, and SOC is State of Charge of the battery

As the objective function is a Mixed Integer Non-Linear Programming problem, the Genetic Algorithm is adopted to simulate and optimize the model. The simulation follows a strategy defined by our objective function and constraints. Basically, it follows a pattern that aims to supply all the stadium’s load demands with the PV generation, with a logic flow to trigger the use of the battery’s energy if the PV generation is insufficient to handle the load demand at any point.
Results
The optimization yields the following optimal sizing:
- 181 solar panels, 2589 battery cells are required and with an initial SOC of 62%
- Total cost of the system amounts to 1.82 million € whereas the yearly revenue based on unused power sold to the grid reaches 1.15 million €
- Approximate payback period lies around 19 months

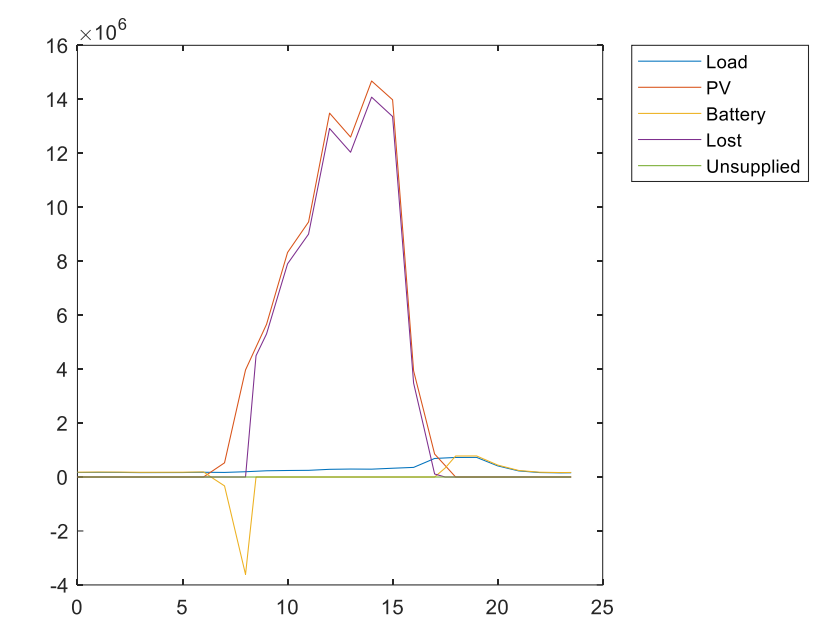
With regards to the result shown above, it is explicit that there is asynchronization between the peak of the power generated by the photovoltaic and the power needed by the load. With 181 number of PV panels, the power that can be produced in the peak hour of around 13h is up to 15 GW. Meanwhile, the load is peaking in around 17h – 20h when the PV production is already declining. This discrepancy results in the high amount of power lost which, in certain hour, its amount is as high as the power generated.
Furthermore, in the early hours of PV generation at 7h – 9h, the generated power is concentrated to charge the battery as shown by the yellow line going to the direction of negative power. In this period, the generated power is stored in the battery and there is no power lost. However, when the battery starts to be fully charged to its upper bound constraint of 95%, the amount of power produced is not getting stored anymore and turned to be the lost power presented by the purple line in the graph. The amount of power generated by the PV and the lost power are then increasing to its peak before it starts decreasing, based on the solar irradiance of the hour during the day.